

Powershell is, well powerful. Microsoft is making Powershell the future of Windows Management starting with Windows Server 2012. For us security peeps, Powershell is capable of doing a LOT of security tasks, like Ben Ten, @Ben0xA showed at his Powershell workshop at BSidesDFW. With all the capabilities Powershell has leveraging .NET, you and the hackers can do just about anything!
So how do we monitor and defend against such a powerful hacker tool? MetaSploit and the Social Engineering Toolkit uses Powershell as does PowerCat, a Powershell netcat tool. Powershell is used since commands can be executed and no files are dropped on disk, unless you want to, making it VERY hard to detect... Or is it hard to detect?
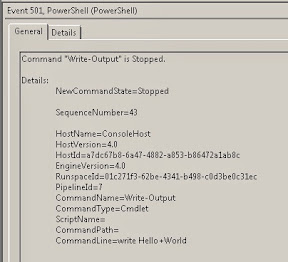
You log it, that's how. But alas, Microsoft does not enable what you need by default so you must do some work to get the commands properly logged. If Powershell is executed you will see EventID 4688, but that only tells you Powershell executed, not what was executed. We security peeps need more details, but first execute a few Powershell commands and look at the logs. see any command lines???? Nope...
If you want to improve your security posture and protect against Powershell misuse and abuse, and just plain know what the heck is going on with Powershell in your environment, give this a test drive.
1. Create an All User profile (profile.ps1) so you can enable some global variables
2. Enable two global variables so Powershell will log what is entered at the Command Line
3. Increase the size of the two PowerShell Logs
4. Gather the two PowerShell logs
5. Enable file auditing to profile.ps1 so you know if anyone changes the default profile! Most important in case the bad guys look for, modify and/or delete it.
#1. Create profile.ps1 in \Windows\System32\WindowsPowerShell\v1.0. Add something to the beginning of the profile so you know the profile is working, for example; change the drive letter to D:, assuming you have one, or echo a Reg Rey or write a Reg Key entry (great to log for later).
#2. Add the following two variables to your profile.ps1
a) $LogCommandHealthEvent = $true
b) $LogCommandLifecycleEvent = $true
Sample profile.ps1
----------------------
CD D:\
$LogCommandHealthEvent = $true
$LogCommandLifecycleEvent = $true
WARNING: If you use usernames and passwords in Powershell scripts, this will show them in the logs. Of course you know to rotate these Creds frequently
#3. Increase the size of the Powershell logs so they collect a LOT of stuff. Do this by opening Event Viewer, navigate to "Applications and Services Logs" right-click and selecting properties of the logs "Windows Powershell" and "Microsoft\Windows\Powershell\Operational" logs, increase their sizes and be generous.
#4. Gather the Powershell logs however you can, through wevtutil, Powershell, or a log agent like Splunk. Below I have included a Splunk query for harvesting Powershell commands being executed, enjoy.
#5. Enable File Auditing on the profile.ps1 file for any changes or deletion so you can alert on this condition in case the bad guys modify and/or delete your default profile. Do this by right clicking on the profile.ps1 file in Explorer, selecting Security, Advanced, Auditing, Continue, Add, type Everyone, Check Names, OK and then select the following properties:
a) Create Files
b) Write Attributes
c) Delete
d) Change permissions
e) Take ownership
Now you will audit any changes, ownership and deletions to the profile.ps1 file. Look in Event Viewer for EventID 4663 Accesses = DELETE and Accesses = WriteData. Test it!
And there you have it, go ahead and test your new settings and execute some Powershell commands and see how it logs unlike before so you can catch your Pentesters, hackers or nefarious admins using Powershell for more than just administration.
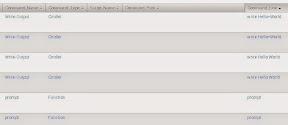
For you Splunkers, here is a query I threw together to monitor what Powershell Command Line parameters are being used. Filter out the good to look for the bad.
1. Add Powershell to your inputs.conf (tweak as needed)
[WinEventLog:Microsoft-Windows-PowerShell/Operational]
disabled = false
[WinEventLog:Windows PowerShell]
disabled = 0
start_from = oldest
current_only = 0
checkpointInterval = 5
2. Create a query like the following:
index=* LogName="*Powershell*" | eval Message=split(Message,". ") | eval Message=mvindex(Message,0) | eval MessageA=split(_raw,"Details:") | eval Message1=mvindex(MessageA,1) | eval Message1 = replace (Message1,"[\n\r]","!!") | eval MessageC=split(Message1,"!!") | eval Message2=mvindex(MessageC,2) | eval Message3=mvindex(MessageC,3) | eval Message4=mvindex(MessageC,4) | eval Message4=split(Message4,"=") | eval PS_Ver=mvindex(Message4,1) | eval Message5=mvindex(MessageC,5) | eval Message6=mvindex(MessageC,6) | eval Message6=split(Message6,"=") | eval Engine_Ver=mvindex(Message6,1) | eval Message7=mvindex(MessageC,7) | eval Message8=mvindex(MessageC,8) | eval Message8=split(Message8,"=") | eval PLine_ID=mvindex(Message8,1) | eval Message9=mvindex(MessageC,9) | eval Message9=split(Message9,"=") | eval Command_Name=mvindex(Message9,1) | eval Message10=mvindex(MessageC,10) | eval Message10=split(Message10,"=") | eval Command_Type=mvindex(Message10,1) | eval Message11=mvindex(MessageC,11) | eval Message11=split(Message11,"=") | eval Script_Name=mvindex(Message11,1) | eval Message12=mvindex(MessageC,12) | eval Message12=split(Message12,"=") | eval Command_Path=mvindex(Message12,1) | eval Message13=mvindex(MessageC,13) | eval Message13=split(Message13,"=") | eval Command_Line=mvindex(Message13,1) | table _time, host, ComputerName, TaskCategory, EventCode, Message, PS_Ver, Engine_Ver, PLine_ID, Command_Name, Command_Type, Script_Name, Command_Path, Command_Line
I split my raw logs versus using RegEx as they are more readable in the future and by others. Powershell logs use a strange end of line carriage return, so another Splunk Ninja Tip on parsing Splunk Logs.
Use SplunkStorm for FREE and test it out!!
Happy PowerLogging!!!
#InfoSec #HackerHurricanel


